Measure what you want, on the real inventory.
A library of 200+ ready-made metrics, a no-code KPI Builder to build your own, and behind every number the list of assets that make it up. A snapshot every day, comparable with any date in your history.
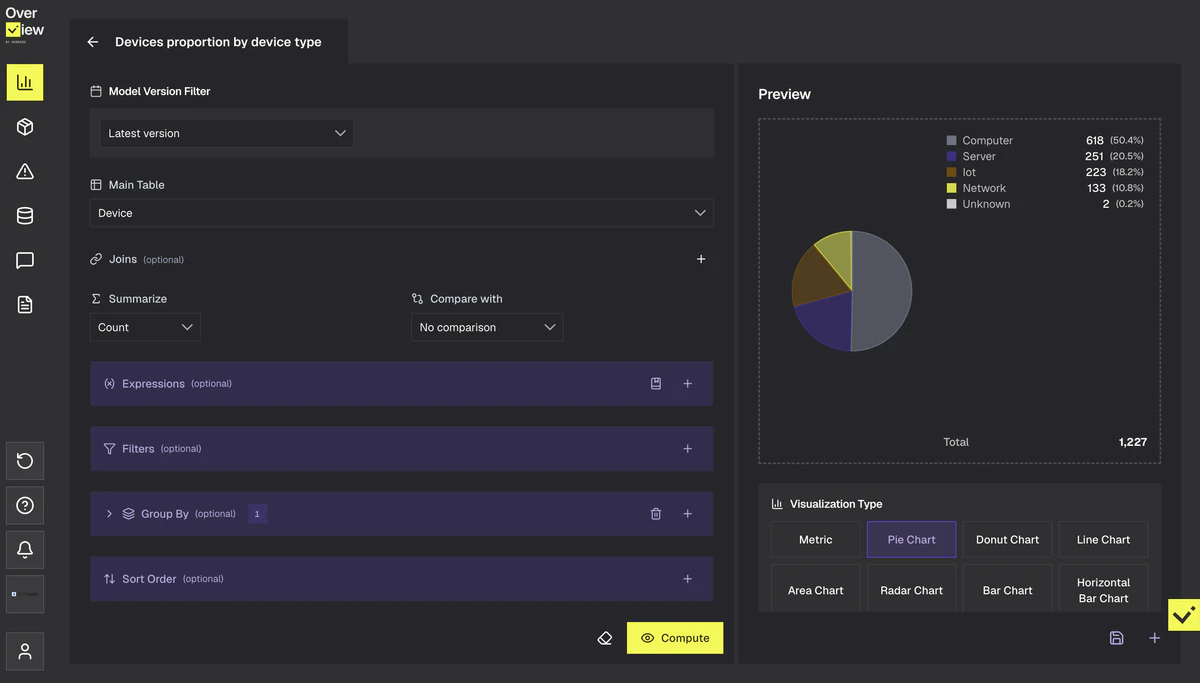
- No code: a table, filters, a grouping
- Every number opens into the list behind it
- A snapshot every day, comparable with any date in your history
WHY IT MATTERS
A self-reported metric is worth nothing. A computed one is worth what sits underneath.
The denominator
“92% of machines covered by the EDR (endpoint detection and response)”: out of what? Here the total is the reconciled inventory, not one tool’s own scope. The rate is honest because the total is true. That total is what the 41.8% of CISOs with a data consolidation project are after (CESIN white paper, 2024).
The detail behind the number
A number you cannot open is a number you cannot stand behind. Every aggregated value opens into the list of machines, users or vulnerabilities that make it up.
Time
A dashboard that only shows today answers neither “since when?” nor “is it improving?”. A snapshot of the inventory is taken every day and kept for three months, twelve months or the life of the contract, depending on your plan.
THREE WAYS TO A METRIC
Pick, build, or describe
The result is the same in all three cases: a KPI you can reopen, review and edit.
Pick from the library
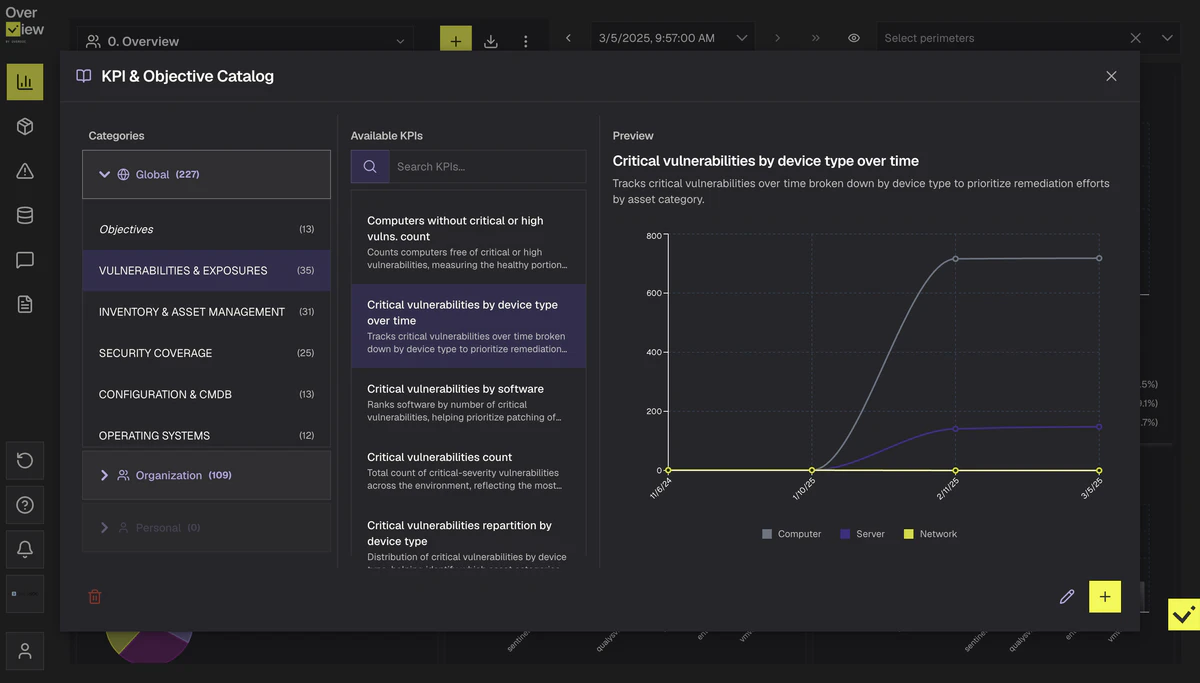
Over 200 ready-made metrics, sorted by domain: EDR coverage, directory hygiene, vulnerabilities, backups, licenses. Live preview, then one click to add it to a dashboard.
Simulate my metrics →Build in the KPI Builder
The standard route. You pick the table, the columns, the filters and the grouping; the preview updates, the chart type is suggested. No code.
See the steps ↓Describe it to Workbench
You describe the metric in a sentence, the AI fills the KPI Builder in for you, on your own AI account. The result reopens in the builder like any other: the AI stays an option.
Discover Workbench →THE KPI BUILDER
Five steps, not a single line of code
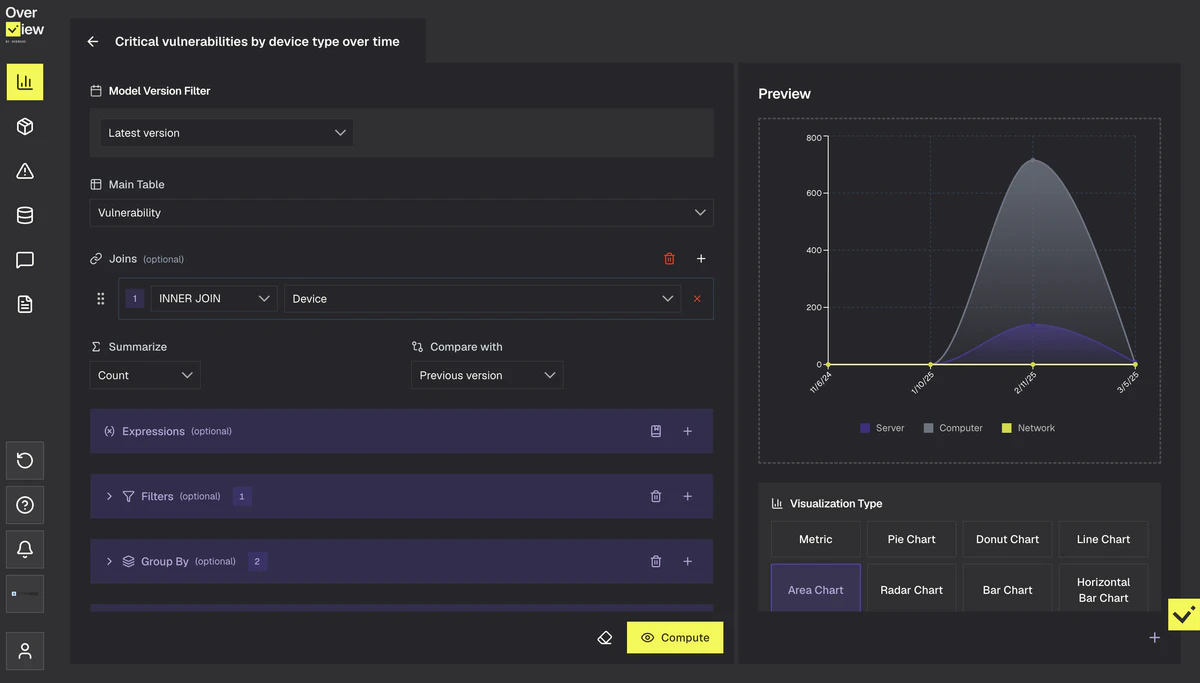
A visual builder, configuration on the left and live preview on the right. What you see is computed on your real data at every step.
- 01
Pick the table
Machines, software, vulnerabilities, networks, applications, users or services. You can pull in related tables: a machine’s vulnerabilities, a user’s machines.
- 02
Set the filters
Servers only, high severity, last seen more than 90 days ago… Conditions combine with AND and OR.
- 03
Group
By site, by operating system, by owner, by month. Grouping is what turns a list into a metric.
- 04
Read the preview
The best-suited chart is suggested automatically from nine types: metric, table, bars, line, area, pie, donut, radar, stacked bars. You can change it.
- 05
Save
A name, a category, a scope: personal, organization or global. The KPI joins the catalog and, if you want, a dashboard right away.
A saved KPI is not frozen: you reopen it, edit it, save it as a copy if you want to keep the original. The colors you assign to a value stay the same wherever the metric appears.
THE DETAIL
Every number opens
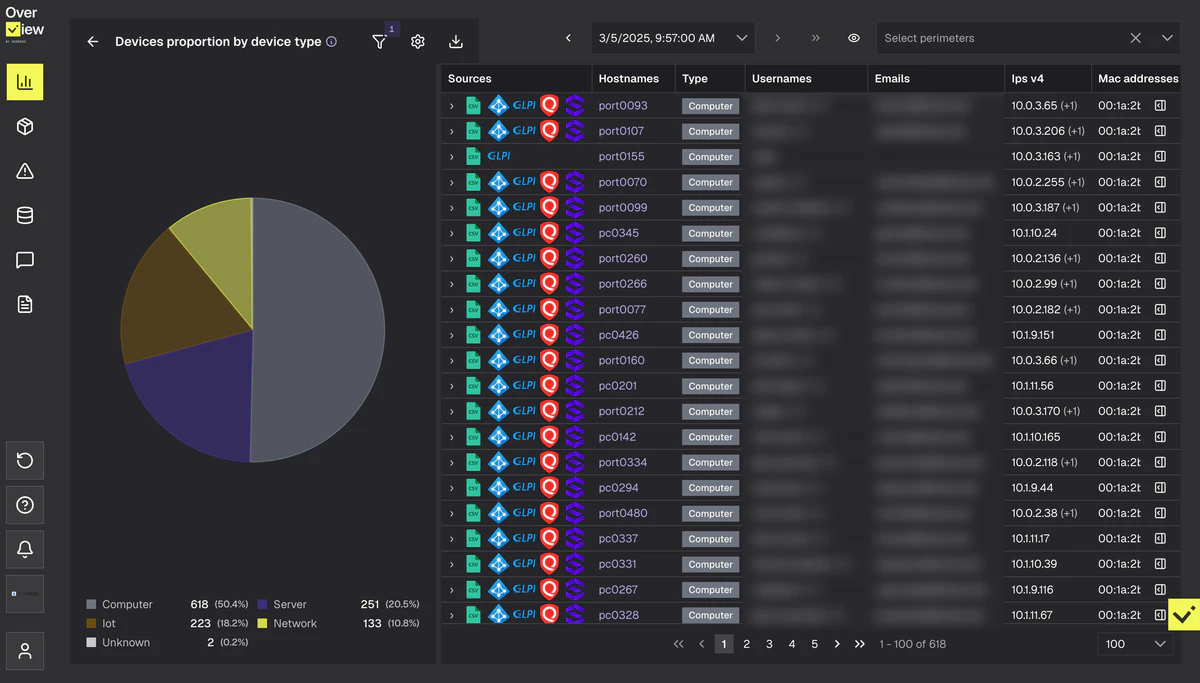
Click a bar, a pie slice or a number: you get the list of machines, users or vulnerabilities behind that value, with the same filters as the number. That is the difference between “42 servers without EDR” and the 42 servers, by name.
- ✓ Filter and sort the list directly, without touching the KPI
- ✓ Add or remove columns, including from related tables
- ✓ Export to CSV, Excel or JSON, with the columns you choose
OBJECTIVES
A ratio, a threshold, a color
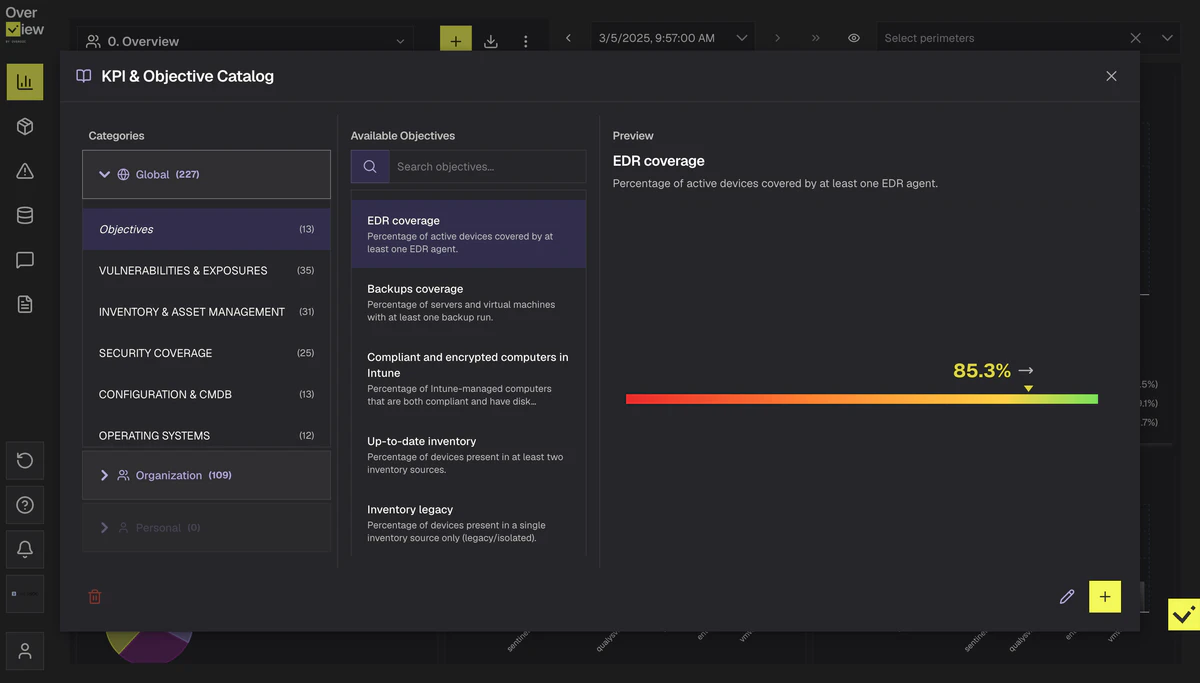
An objective compares two metrics: a reference, which counts the whole population, and a target, which counts those meeting the condition. The ratio is compared to a threshold, and the widget turns green, yellow or red.
- ✓ Minimum threshold for a coverage rate (at least 80% of servers patched)
- ✓ Maximum threshold for a rate to bring down (at most 20% inactive accounts)
- ✓ Trend against the previous snapshot, to see whether it moves the right way
TIME
A snapshot every day. Kept according to your plan.
A snapshot of the inventory is taken once a day and kept for three months, twelve months or the life of the contract, depending on your plan. Every metric carries the date filter that says exactly which snapshot it reads: the latest, a specific date, a range, or the last N days.
- ✓ Re-run a measure as of an audit date, exactly as it stood that day
- ✓ Compare against the previous snapshot or a fixed date: deltas show in green and red
- ✓ Track a trend over thirty days or a year, without having archived anything yourself
DASHBOARDS
One dashboard per audience
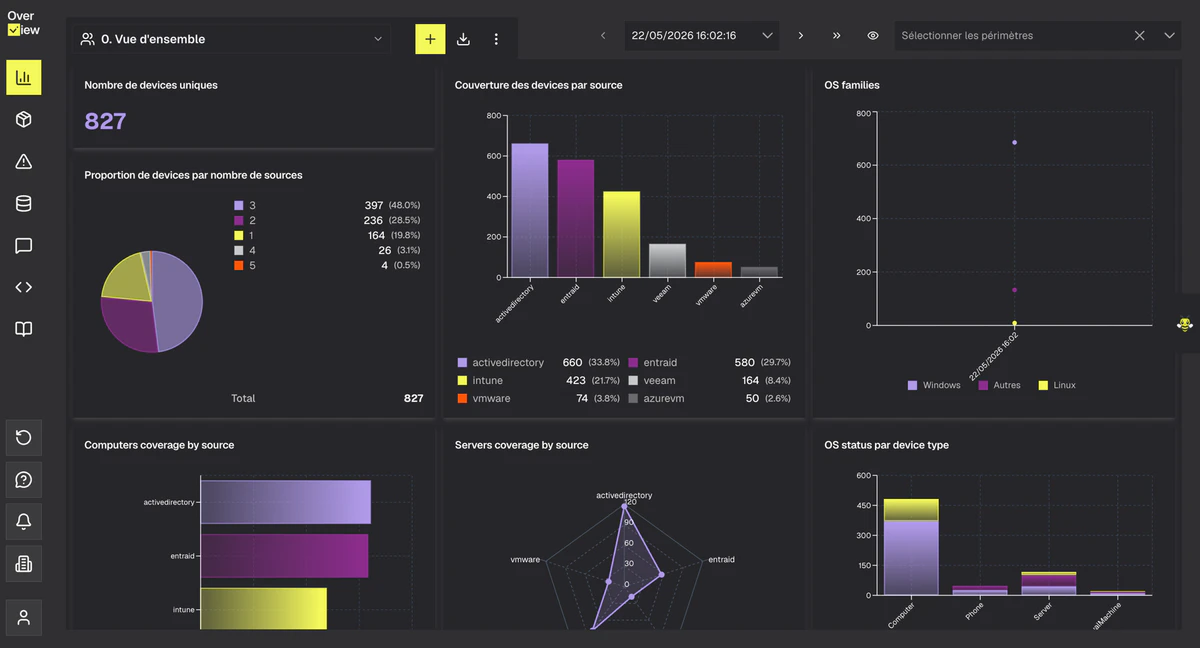
The board wants three numbers, the CIO wants fifteen, the tech team wants the list. Each dashboard assembles the measures it needs, at the scope it needs.
- ✓ Ready-made dashboard templates in the catalog, to customize afterwards
- ✓ Personal scope while you build, organization scope when it is ready
- ✓ Workbench Smart Reports can add commentary to a dashboard every time the inventory refreshes
FRAMEWORKS
Aligned with NIS 2, ISO 27001, DORA and ANSSI. Certifying nothing.
The library follows the requirements these regulations place on IT and security: endpoint coverage, directory hygiene, vulnerability management, access governance, backups. OverView gives you the measure and the auditable evidence; compliance stays your call, and your auditor’s.
The regulations
FREQUENTLY ASKED
What your teams will ask
A metric is worth what sits underneath
All of these numbers are computed on the inventory Unicity builds from your tools. That is what makes the denominator true.
Understand Unicity →Describe it, Workbench builds it
The same page, filled in by the AI from a sentence, on your key and under your provider’s contract.
Discover Workbench →Ready to take back control?
Plug in your sources, see for yourself in 14 days. Free access, no commitment, 45-minute setup.
Start for free